
“Lagging Technical Indicators“
> Explanatory Article by Marios Kyriakou, MSc Economics

About the author: Marios Kyriakou has a bachelor’s degree in Economics from the University of Cyprus and a master’s degree in Economics from the University of Warwick. He is also a holder of CySEC’s Advanced Certificate in Financial Services Legal Framework and a professional in Online Trading, Forex and CFDs with more than 7 years of experience.
Watch our Videos on YouTube
> Should you find this article and video useful share so you can help your friends too. Click the like button and the subscribe button to our YouTube channel so in the future, you can be notified when we upload more useful free educational videos to watch.
<Last updated 18.04.2020>
Dear reader,
Hi! If you are interested in Forex please read carefully the below article that shows how you can make use of the various analysis tools developed for trading platforms and specifically technical indicators in this case.
Leading versus Lagging Indicators
By analyzing historical data, technical analysts use indicators to predict future price movements. It involves identifying trading opportunities by analyzing statistical trends gathered from trading activity, such as price movement and volume.
Leading indicators attempt to predict where the price is headed while lagging indicators offer delayed feedback, which means they give a signal once the price movement has already passed or is in progress.
Moving Average
The Simple Moving Average (SMA), the most popular technical analysis tool. It is often used to identify trend direction but can be used to generate potential buy and sell signals. It is the simplest type of moving average.
The main reason for calculating the moving average of an asset is to help smooth out the price data by creating a constantly updated average price.
Simple Moving Average
Example:
If you were to plot a 5-period simple moving average on a 30-minute chart, you would add up the closing prices of the last 150 minutes and then divide that number by 5. (so for each of the 5 candlesticks). Because you are taking the averages of past price history, you only see the general path of the recent past and the general direction of “future” short-term price action.

With the use of SMAs, we can tell whether a pair is trending up, trending down, or just ranging.
NOTE: Simple moving averages can be distorted by shocks.
i.e. poor results of an economic report: the direction of the price/trend is poorly indicated. Simple moving average assigns equal weighting to all values.
To correct this Exponential moving averages (EMA) give more weight to the most recent data. Helps more in smoothing out price action by filtering out the “noise” from random short-term price fluctuations.
Exponential Moving Average
When asset prices cross their moving averages, it may generate a trading signal for technical traders.
EMA is a weighted average that gives greater importance to the price on more recent days, making it an indicator that is more responsive to new information. If price action tends to stay below the moving average, then it indicates that it is in a DOWNTREND.
FALSE INDICATION Example: As it turns out, traders just reacted to the news, but the trend continued, and the price kept heading lower!

Moving Average Convergence Divergence – MACD
A trend-following momentum indicator that shows the relationship between two moving averages.
The MACD is calculated by subtracting the 26-period Exponential Moving Average (EMA) from the 12-period EMA.
A nine-day EMA of the MACD called the “signal line,” is then plotted on top of the MACD line, which can function as a trigger for buy and sell signals.

The MACD line (blue) is the difference between the 12-period EMA (exponential moving average) and the 26-period EMA.
The average or Signal Line (red) is a 9-period EMA of the MACD line.
The bar graph or “histogram” shows the divergence of these two lines.
MACD True (version 1) triggers technical signals when it crosses above (to buy) or below (to sell) its signal line.

The speed of crossovers is also taken as a signal of an overbought or oversold market. Although the MACD is a lagging indicator when trading on the crossovers, it is more of a leading when it is used to highlight possible overbought or oversold conditions.
The default version of the indicator displays the traditional MACD line as a bar graph.

The signal line is displayed normally, but there is no bar graph or “histogram” showing the divergence between the MACD and the signal line.
Many traders will also watch for a move above or below the zero line. A move above zero is a signal to buy, while a cross below zero is a signal to sell.

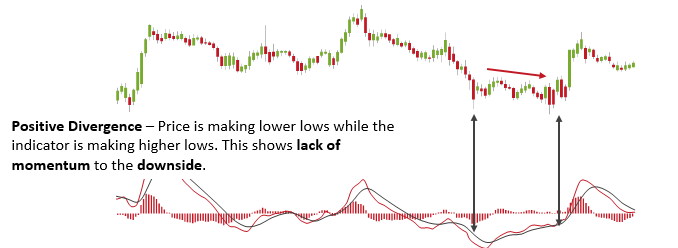
Divergence

Average Directional Index – ADX
The average directional index (ADX) is a technical analysis indicator used to determine the strength of a trend.
The trend can be either up or down, and this is shown by two accompanying indicators, the Negative Directional Indicator (-DI) and the Positive Directional Indicator (+DI).
The price is moving up when +DI is above -DI, and the price is moving down when -DI is above +DI.
Crosses between +DI and -DI are potential trading signals. The trend has strength when ADX is above 25. The trend is weak, or the price is trendless when ADX is below 20.

When the +DMI is above the -DMI, prices are moving up, and ADX measures the strength of the uptrend.
When the -DMI is above the +DMI, prices are moving down, and ADX measures the strength of the downtrend.
Calculate +DM, -DM, and True Range (TR) for each period. 14 periods are typically used.
Use ADX readings above 25 to suggest that the trend is strong enough for trend-trading strategies.
When ADX is below 25, the price enters a range.
When ADX rises above 25, the price tends to trend.

The ADX indicator works best when used in combination with other technical indicators such as the RSI. The ADX indicator can only help us to gauge the intensity of the trend. We need RSI indicator for entry signals.
Bollinger Bands
Bollinger Bands are a lagging indicator. This is because the tool is based on a simple moving average, which takes the average price of several price bars.
It is defined by a set of trendlines plotted (positively and negatively) away from a simple moving average (SMA).
The upper and lower bands are typically 2 standard deviations +/- from a 20-day simple moving average but can be modified.
Designed to discover opportunities that give investors a higher probability of properly identifying when an asset is oversold or overbought

When the bands come close together, constricting the moving average, it is called a squeeze. A squeeze signals a period of low volatility and is considered by traders to be a potential sign of future increased volatility and possible trading opportunities.
Approximately 90% of price action occurs between the two bands. Any breakout above or below the bands is a major event. However, Breakouts provide NO clue as to the direction and extent of future price movement.


When asset prices continually touch the upper Bollinger Band, the prices are thought to be overbought;
When they continually touch the lower band, prices are thought to be oversold, triggering a buy signal.
When using Bollinger Bands, designate the upper and lower bands as price targets. If the price deflects off the lower band and crosses above the 20-day average (the middle line), the upper band comes to represent the upper price target.
Parabolic SAR
A popular indicator that is mainly used by traders to determine the future short-term momentum of a given asset.
Identifies potential reversals in the market price direction of traded goods. Highlights the direction an asset is moving, as well as providing entry and exit points.
This technical indicator uses a method called “SAR,” or stop and reverse, to determine trend direction and potential reversals in price.
The parabolic SAR indicator appears on a chart as a series of dots, either above or below the price, depending on the direction the price is moving.
A dot is placed below the price when it is trending upward, and above the price when it is trending downward.

When the dots flip, it indicates a potential change in price direction (reversal). For example, if the dots are above the price, when they flip below, it could signal a further rise.
As the price rises, the dots will rise as well, first slowly and then picking up speed and accelerating with the trend.
FALSE INDICATION
It can lead to many false signals when the price moves sideways or is trading in a choppy market.
It is up to the trader to determine which trades to take and which to leave alone.
For example, during a downtrend, it is better to take only short sales. (with the trend).

It is better to have several indicators confirm a certain signal than to rely solely on one specific indicator. Complement the SAR trading signals by using other indicators such as a stochastic, moving average, or the ADX. The price is above the moving average (200 p), focus on taking the buy signals (dots move from above to below).

Alligator Indicator
The Alligator is used to confirm ongoing trends and their primary direction
This trend-following Alligator indicator follows the premise that financial markets and individual securities trend just 15% to 30% of the time while grinding through sideways ranges the other 70% to 85% of the time.
The Alligator indicator uses three smoothed moving averages, set at 5, 8 and 13 periods, which are all Fibonacci numbers. The initial smoothed average is calculated with a simple moving average (SMA), adding additional smoothed averages that slow down indicator turns.
> Jaw (blue line) – starts with the 13-bar SMMA and is smoothed by eight bars on subsequent values.
> Teeth (red line) – start with the eight-bar SMMA and is smoothed by five bars on subsequent values.
> Lips (green line) – start with the five-bar SMMA and smoothed by three bars on subsequent values.
The indicator applies convergence-divergence relationships to build trading signals
The Lips crossing down through the other lines signals a short sale opportunity while crossing upward signals a buying opportunity.

“I hope I am clear on this one. If not, contact us on social media and we will do our best to help you.
Thank you for reading my articles and watching my videos.”
Marios Kyriakou